WebSphere Message Broker is an enterprise service bus providing connectivity and universal data transformation for service-oriented architecture (SOA) and non-SOA environments. It performs comprehensive range of operations on data, including routing, filtering, enrichment, multicast for publish-subscribe, sequencing, and aggregation.
Applications Manager monitors availability and performance of the Message Broker, execution group and message flow and memory usage of the execution group. Resolve incidents before they become an issue, enjoy improved service levels and reduced risk of downtime within your WebSphere MQ infrastructure. You can also collect Message Flow Accounting and Resource Statistics and configure thresholds to the attributes monitored by the server based on these details. The monitoring details of IBM WebSphere Message Broker are represented graphically that helps to understand the parameters with ease.
Message Broker Execution Group
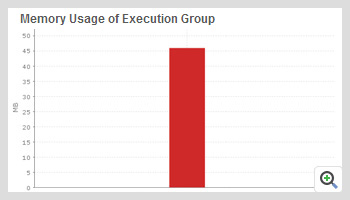
- Monitor the Message Broker's consumption of system memory over time.
- Track garbage collection that might be occurring in the execution group.
- Get a graphical view of memory usage of execution groups.
Message Flow Accounting and Stats
- Analyze broker environments and monitor message flow in real-time.
- Get accounting statistics like message flow counts, rates of messages, processing time and error count.
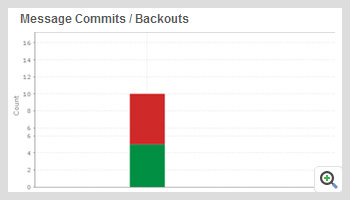
- Get a graphical view, Message Commits/Backout statistics and reports for the message flows.


