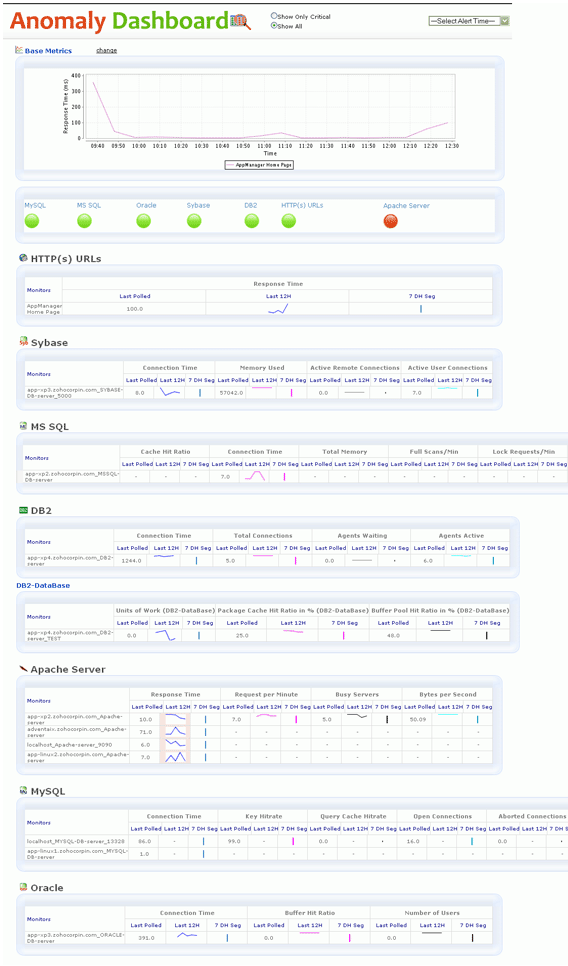
The performance of monitors can be viewed from Anomaly Dashboards. It helps the user to intuitively scan through hundreds of performance metrics with ease. If the health of monitor/monitor group has turned critical, you can troubleshoot via Anomaly Dashboards.
Sparkline Graphs on last polled value, 12 hour average, 7 day segmented by hour metrics, etc. help provide the visibility you will need to quickly identify a problem when an Event is generated in production. Additionally, the ability to even view metrics across technologies for a specific "Business Service" adds to the flexibility and usability of the dashboard.
Click here to know more about Anomaly Detection.