applications 管理器插件
OpManager 中的 application 管理器(APM)插件可帮助企业持续跟踪关键 application 的性能,确保高可用性。借助 APM 插件,您可以监控 Tomcat、Oracle 和 WebSphere 等 application Server。您还可以在集中控制台中跟踪数据库、容器、云 application、邮件等终端用户服务的性能。OpManager 与 APM 插件的组合提供了一体化的网络与 application 监控解决方案。
如何下载并安装 APM 插件
- 您可以在 OpManager 界面中下载 APM 插件(导航至 Settings-> General Settings -> Third Party Integrations)。
- 点击 Configure application Manager Plugin 并下载文件。
- 查看我们的安装指南,了解安装 applications Monitoring 插件的步骤。
先决条件:请确保在 OpManager 中安装了兼容版本的 APM 插件。
在 APM 插件中发现监视器
下载并安装 application Manager 插件后,您即可在 OpManager 控制台中访问深入的 application 监控数据。applications 选项卡可详细展示已监控的 application 列表、关联的监视器、网络环境中受支持的云 application、告警以及为 application 监控生成的报告。
监视器是指被监控的 application、Server 或服务。使用 APM 插件发现监视器可以通过自动发现或手动方式完成。
完成发现过程后,您可以在 Home 选项卡下查看监视器列表。
用户还可以在 OpManager 中通过以下选项卡获取统一的 application 监控视图:
- Inventory
- Virtualization
- Dashboard
- Alarms
- Notifications
- Reports
- Business Views
- application Manager KPI in Device Snapshot
- APM 插件自监控
Inventory
Inventory 选项卡提供了在 OpManager 中监控的设备和接口的完整列表。从 OpManager 版本 126167 起,在 Inventory 下新增了一个单独的 applications 子选项卡,用于显示通过 APM 插件在 OpManager 中发现的所有 application。(Inventory --> applications)。

此选项卡对 application 监控数据进行了分类,并给出了 application 列表及其可用性状态、类别、发现时间等信息。
Virtualization
容器因其更轻量、更易在不同环境间部署,并能加速服务交付,而在当今被广泛使用。跟踪容器的性能对于确保 application 的健康至关重要。
借助 APM 插件,您可以监控容器,例如被广泛使用的 Kubernetes、OpenShift 和 Docker。
在 Virtualization 选项卡下,提供了一个专门用于监控容器的子选项卡,其中列出了在 OpManager 中发现的容器。
您可以使用右上角的 Add Container 选项发现新的容器。该操作会跳转到专门的 Container Discovery 页面,您可以在此指定相关信息、选择厂商(Kubernetes/OpenShift/Docker),并只需几次点击即可将其添加到 OpManager 中。

application 监控小部件(Dashboard)
OpManager 的 Dashboard 借助可自定义小部件,为您提供整个网络健康状况的综合视图。只有已下载并安装 APM 插件的用户才能查看 APM 小部件。若要查看 application 监控小部件,您需要创建自定义仪表板,然后选择所需的 application 小部件。

支持的 APM 小部件列表:
- application Monitors Summary:基于关键指标提供 application 的性能概览。
- application Monitors Status:提供 application 监视器的整体状态概览。
- application Health and Availability:提供 application 的健康和可用性状态。
- application Monitors HeatMap:提供 application 性能的热力图分析。
- application Monitor Groups Summary:提供 application 组的状态。
- application Monitor Groups Tree view:以树形视图方式提供 application 组的状态。

Alarms
Alarms 用于在阈值条件被违反时向用户发出告警。对于 APM 插件,默认支持的严重性级别为 Critical、Warning(在 OpManager 界面中显示为 Trouble)和 Clear。用户可以为每个严重性级别设置阈值,当实际值超出指定值时,就会生成告警。Alarms 可帮助您在问题失控前主动进行处理。
所有因 application 事件而触发的告警,均可通过 application Manager 插件页面中的 Sync All Alarms 选项(Settings--> General Settings--> Third party integrations)与 OpManager 同步。启用此同步选项后,所有与 APM 相关的告警都可在 All Alarms 选项卡中查看。

此外,在 Alarms 视图下还提供了专门的 application 告警选项卡,仅用于列出 APM 告警。

Notifications
applications manager 允许用户通过多种渠道发送告警,例如发送电子邮件、短信、trap 以及执行命令,以便将监控 application 时产生的任何告警通知给客户。这大大简化了故障的发现与修复,从而确保高可用性。
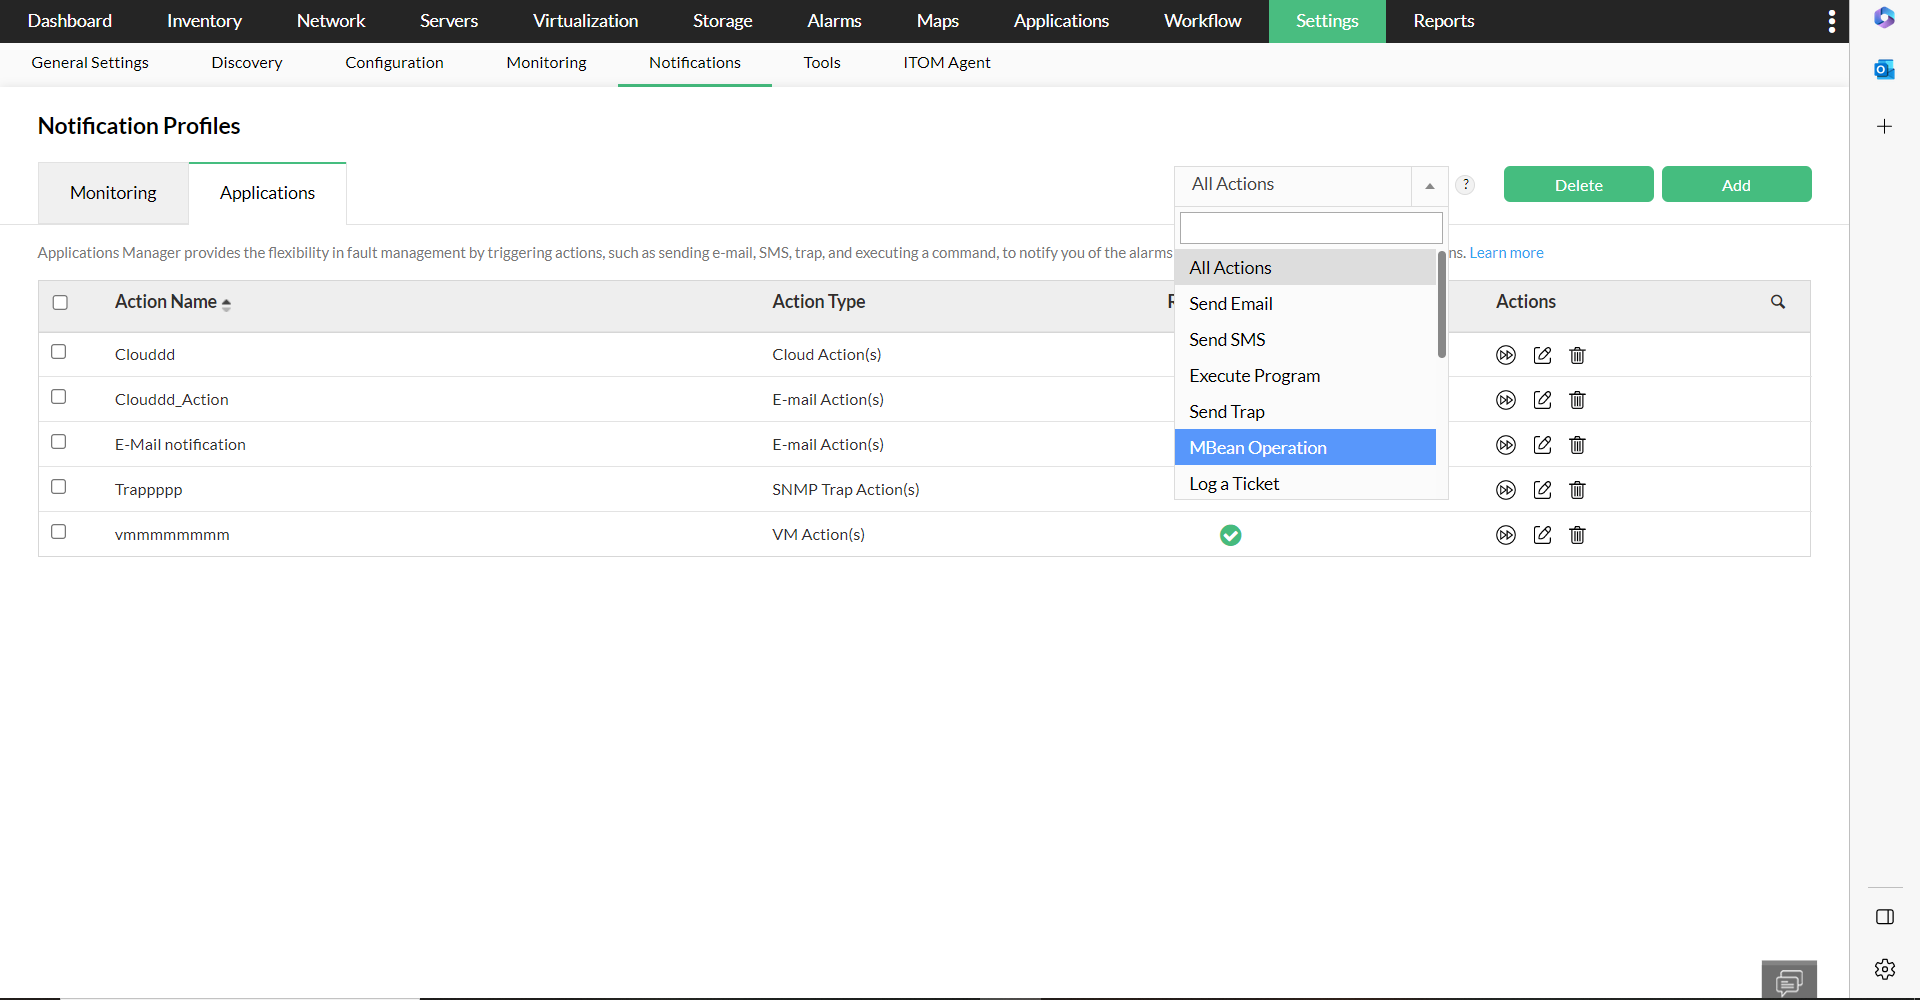
此外,在 OpManager 中的 Settings->Notifications->Notification Profiles->applications 下,提供了专门的 application Actions 选项卡。在该页面中,您可以查看所有操作列表,并对其进行执行、添加、编辑或删除。
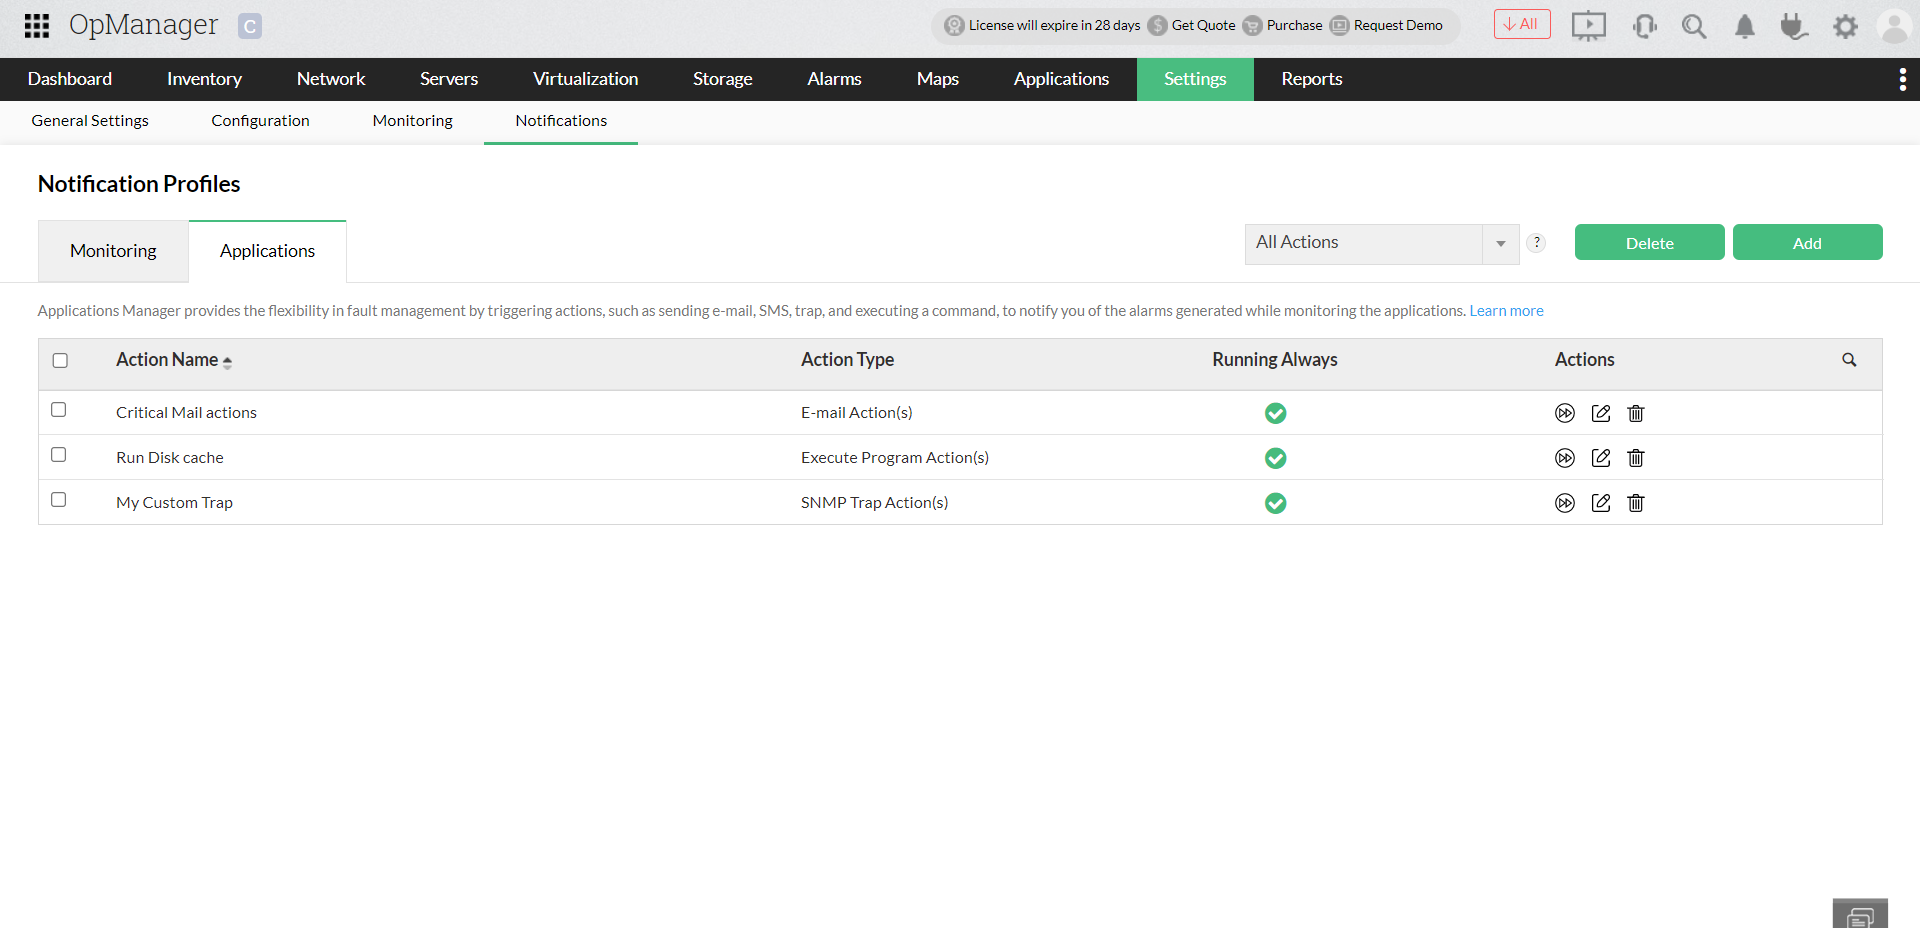
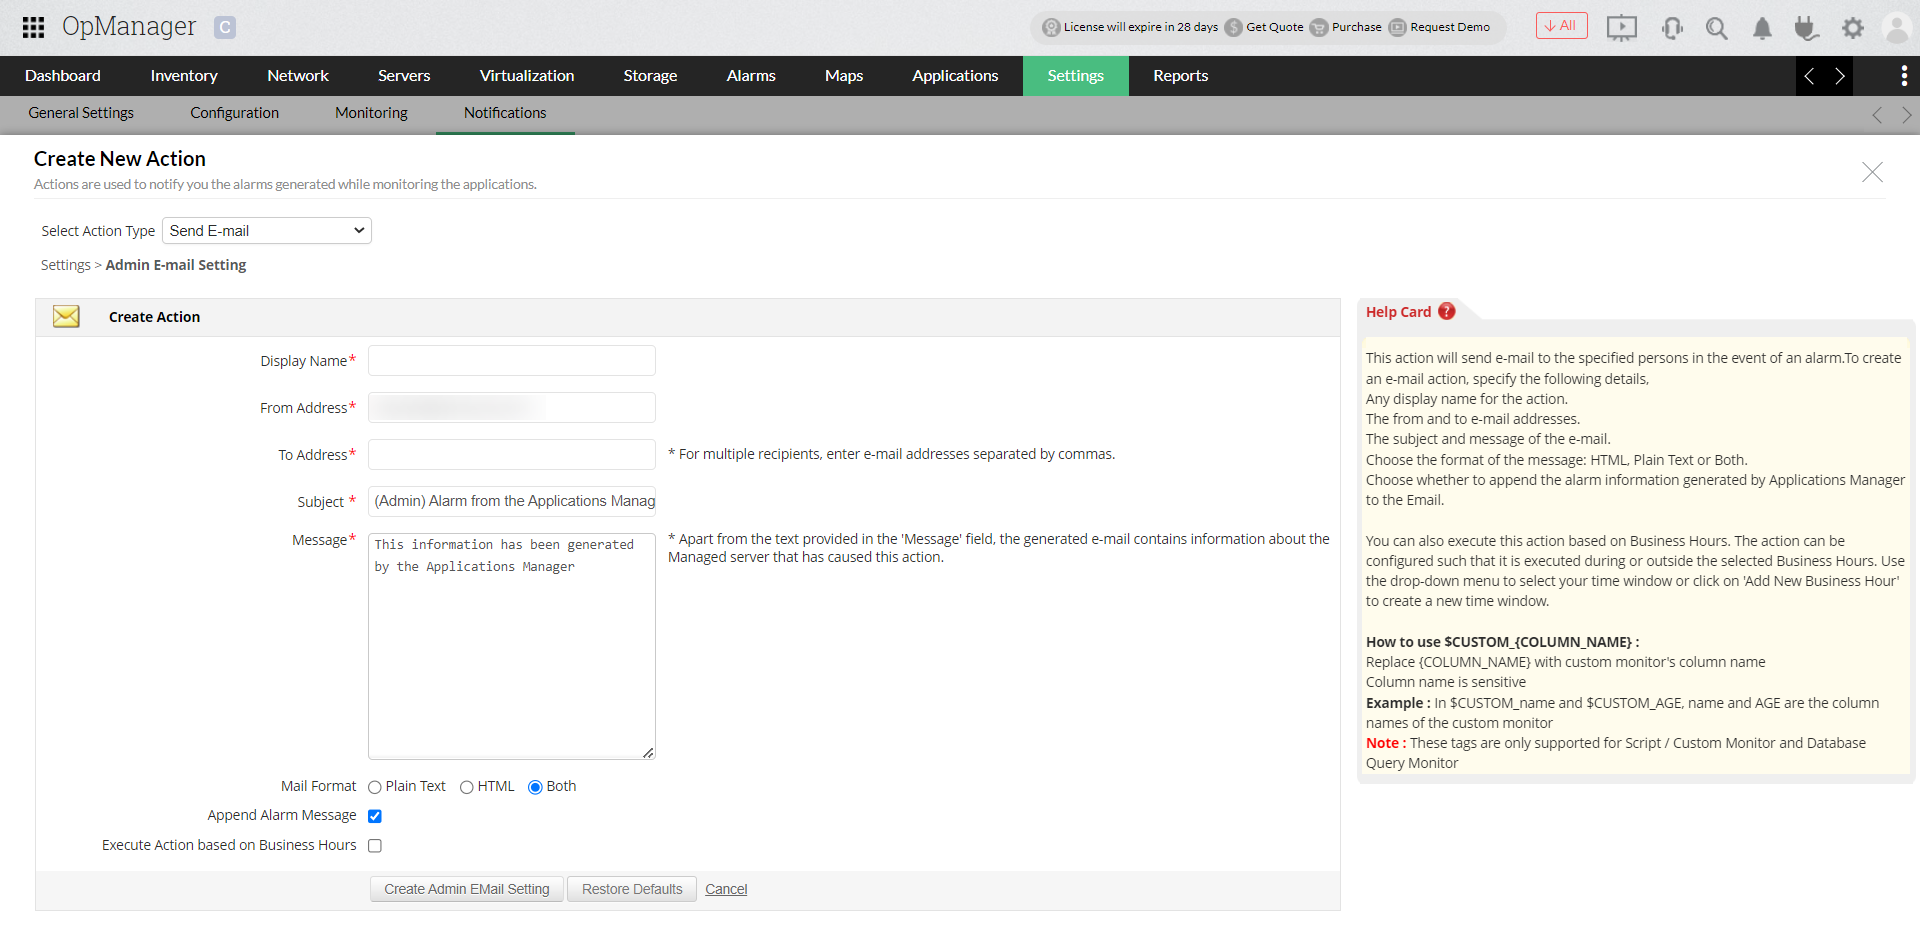
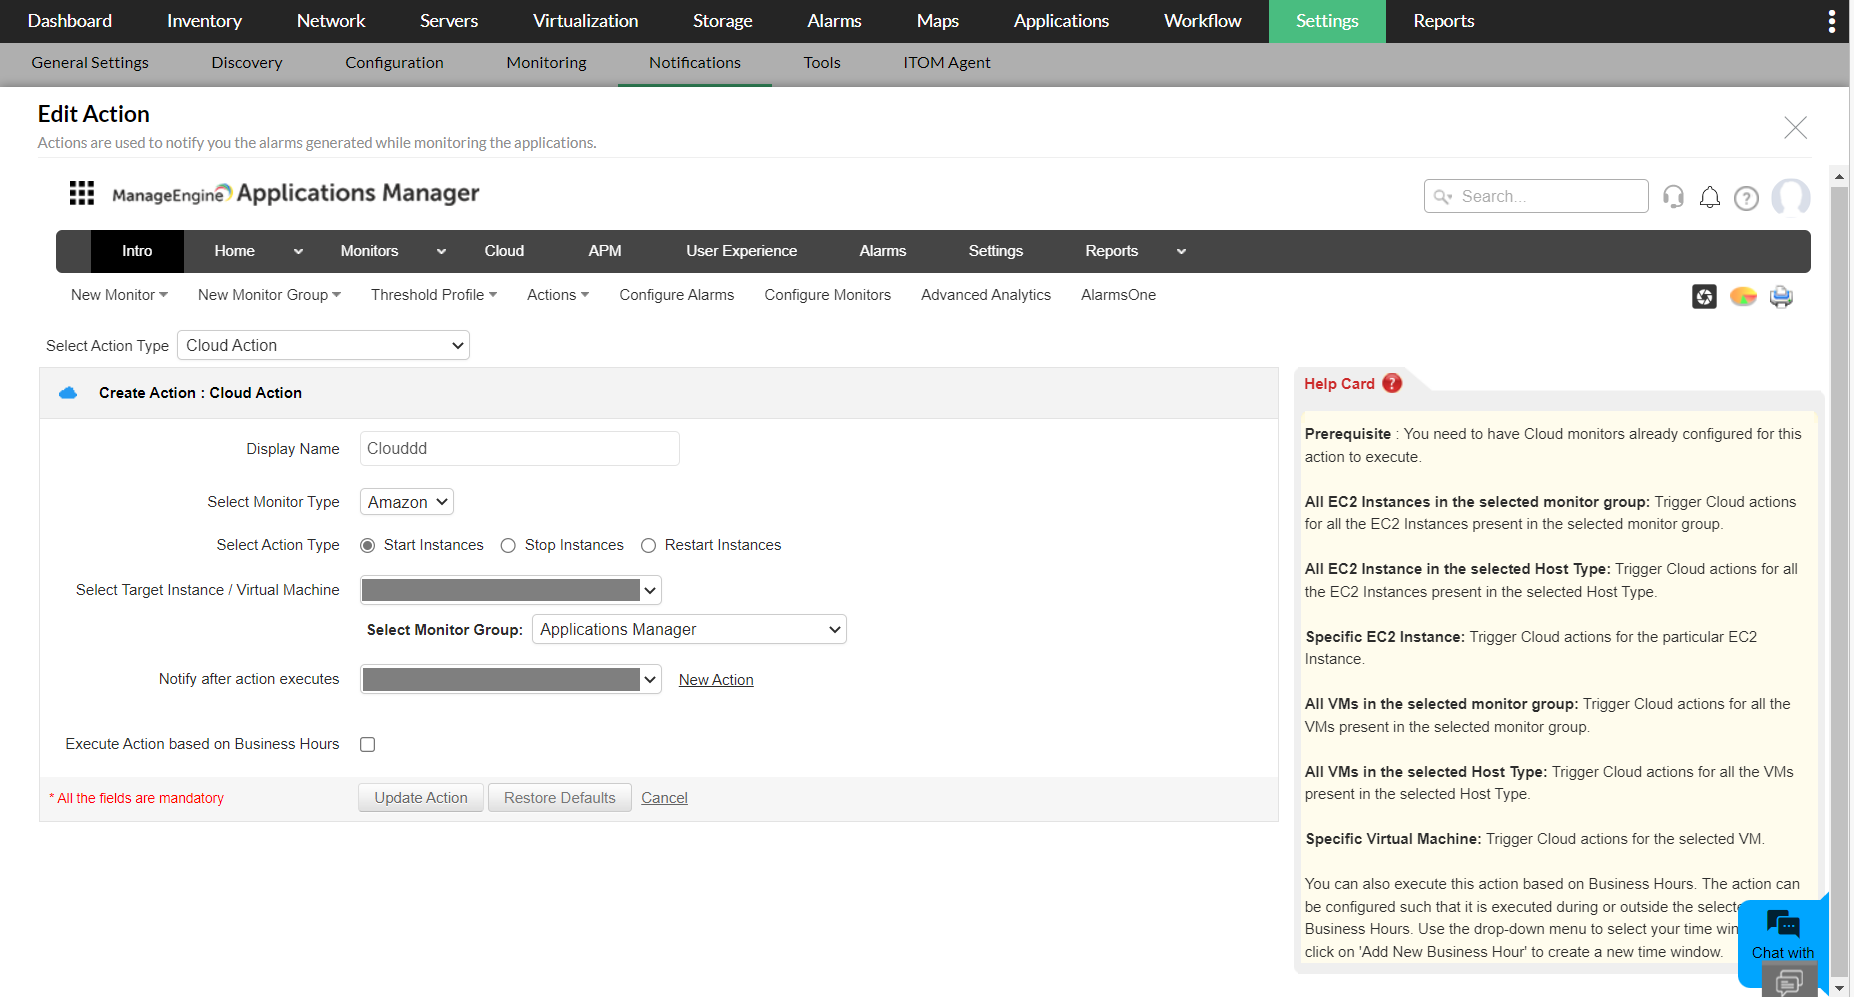
您可以使用右上角的 Add 选项添加新操作。该操作会跳转至用于创建新操作的专用页面,在此您可以填写详细信息并添加操作。了解更多。
Reports 中的 APM 插件数据
所有已安装 APM 插件的用户都可以查看 application 监控报告。APM 报告还细分为 application Server、云应用、融合基础设施、邮件 Server 等类别。

高级报表中的 application 监视器
您现在可以使用高级报表功能创建涵盖 APM 插件监控数据的自定义报告。(此功能仅对已在 OpManager 中下载并启用 APM 插件的客户开放)。在创建新报表时,您可以选择 applications 模块,以显示与 application 监控数据关联的监视器。

随后,您可以参考创建高级报表的类似步骤,创建包含 applications 数据的新报表。您还可以计划此报表,并通过电子邮件定期接收。
包含 application 监视器的 Business View
OpManager 的 Business View 最初旨在为您提供网络架构的高层视图,以便更轻松地进行事件管理和高效的故障排查。从 v128168 版本起,OpManager 允许您将来自 applications Manager 插件的监视器添加到 OpManager 的 Business View 中。这将为您提供在 OpManager 中(通过 APM 插件)配置的 application 监视器的图形化展示。
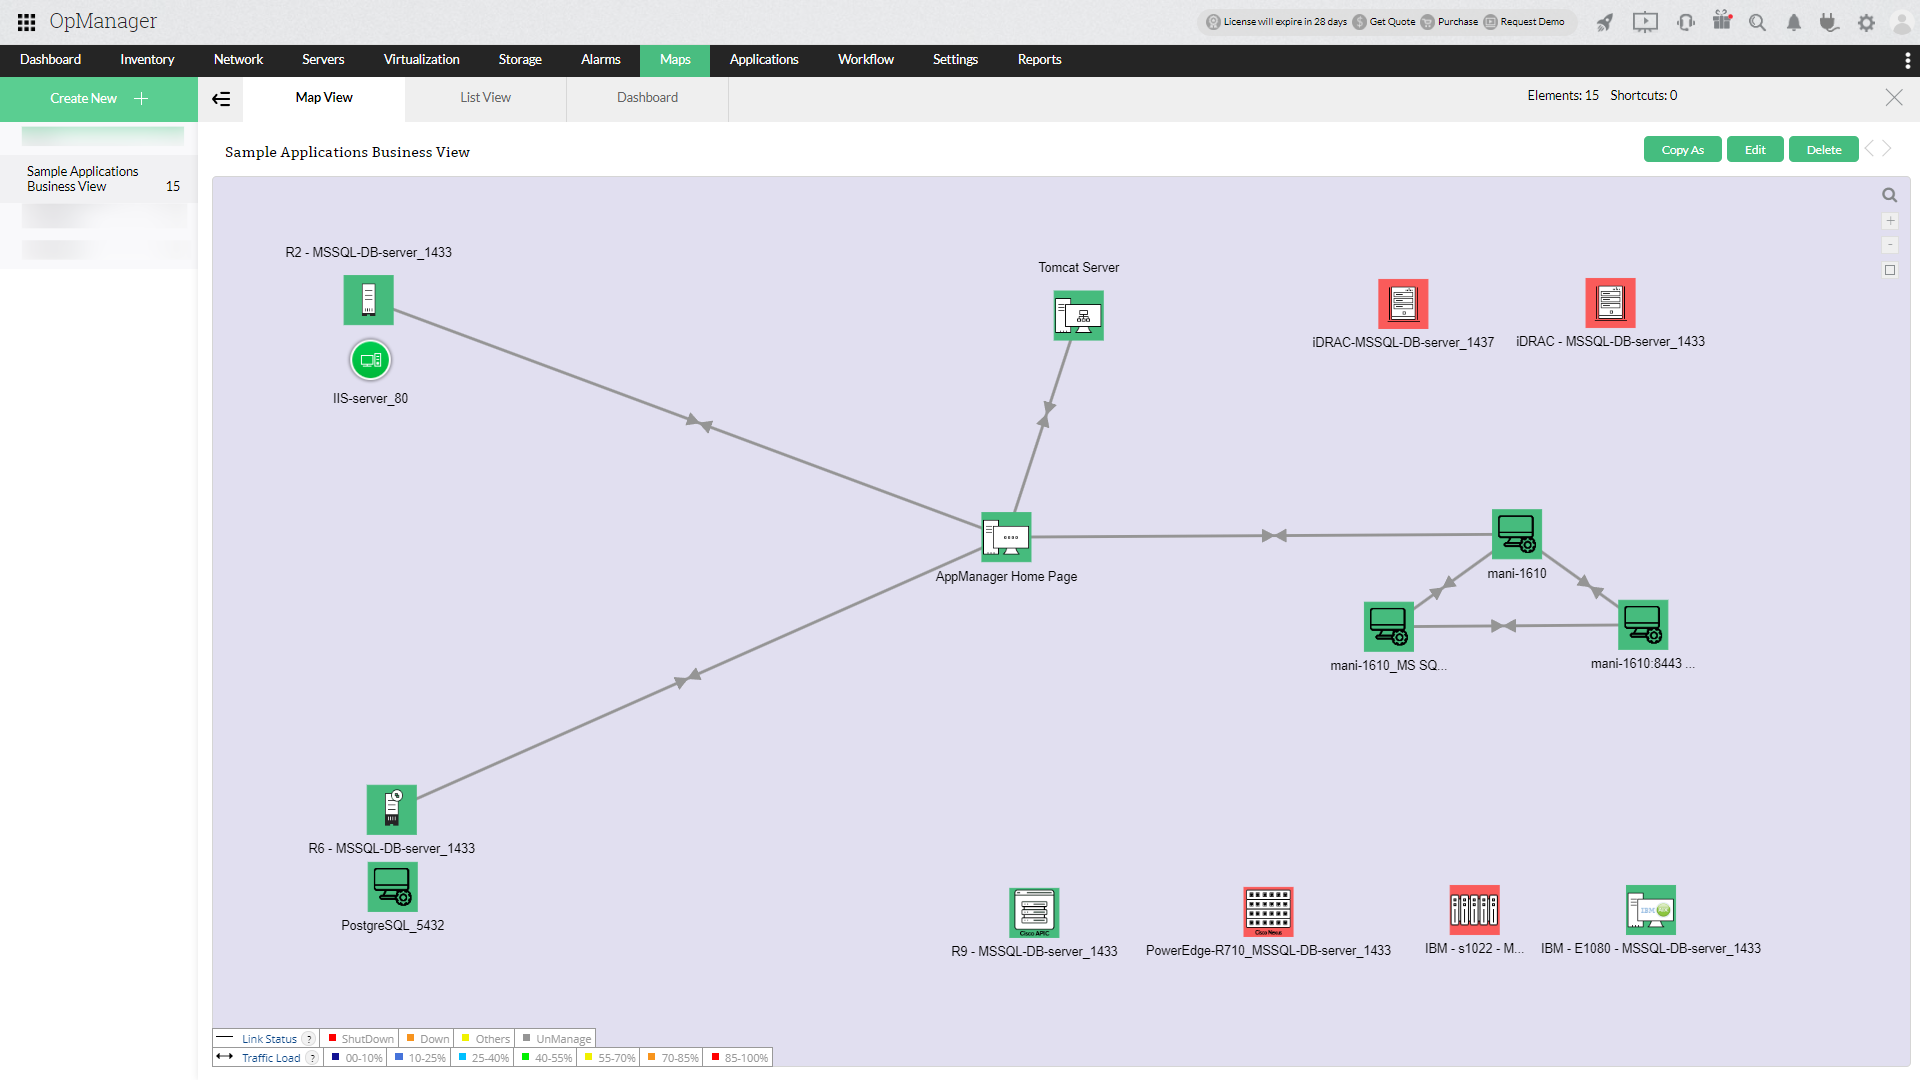
如需了解如何为 APM 监视器配置 Business View,请查看本页面。
Device Snapshot 中的 application Manager KPI
在 OpManager 中,application 监控变得更加无缝,关键指标可直接在 Device Snapshot 视图中获得,从而更深入地洞察 application 性能。

支持的 application 性能监视器
| 类别 | 监视器 |
|---|---|
| application Servers | |
| Database Servers | |
| Middleware Servers | |
| SAP Servers | |
| Web Servers/Services |
APM 插件自监控
如果通过自监控检测到 applications Manager 插件宕机,OpManager 将会在预定义次数内自动尝试重启插件。这可确保停机时间最小化,并有助于维持持续监控,而无需人工干预。

感谢您的反馈!