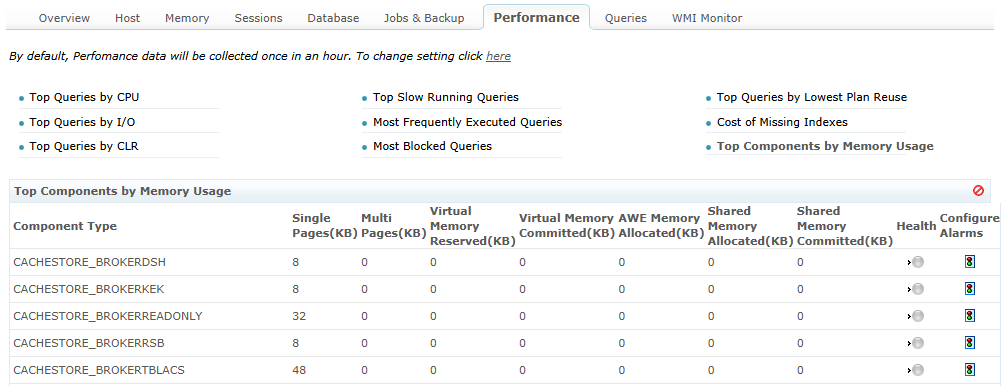
SQLDBManager Plus monitors SQL components by its memory usage and lists them in a tabular format in the following order:
- Component Type
- Single Page (KB)
- Multi Pages (KB)
- Virtual Memory Reserved (KB)
- Virtual Memory Committed (KB)
- AWE Memory Allocated (KB)
- Shared Memory Allocated (KB)
- Shared Memory Committed (KB)
- Health
SQLDBManager Plus also allows the DBA to configure alarms for the each SQL component. Whenever the threshold value of the SQL component is breached, the DBA gets instant notification making it easier to troubleshoot the problem quickly.


