Monitor your IBM database & WebSphere Server with Ease
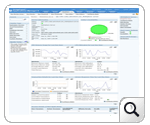
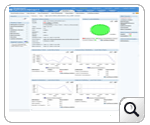
ManageEngine Applications Manager provides application server monitoring, database monitoring, server monitoring, web services monitoring and an array of other application management capability that will help IT administrators manage their resources. For WebSphere monitoring, Applications Manager delivers comprehensive fault management and proactive alarm notifications, checking for impending problems, triggering appropriate actions, and gathering performance data for planning, analysis, and reporting.
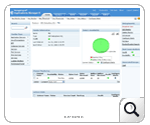
For database monitoring, it helps database administrators (DBAs) and system administrators by notifying about potential database performance problems. In database server monitoring, Applications Manager connects to the database and ensures it is up. It executes database queries to collect performance statistics and send alarms, if the database performance crosses a given threshold. With out-of-the box reports, DBAs can plan inventory requirements and troubleshoot incidents quickly.
To learn more about each monitoring capabilities, follow the link given below:
Key Monitoring Features:
- Monitoring in Network Deployment mode
- Monitors performance statistics such as database connection pool, JVM memory usage, user sessions, etc. More
Key Monitoring Features:
- Channel ( Status, Bytes- Sent, Received, Buffers- Sent, Received)
- Queue (Current Depth, % of Queue Occupied, Open Input Count, Open Output Count, Health) More...
Key Monitoring Features:
- Monitors performance statistics such as connection statistics, agent statistics etc. alarms can be configured for these parameters. More...


